Chart Types on Pocket Option
Pocket Option offers traders four main chart types for analyzing price movement. Each one visualizes market data differently, providing varying depths of information about an asset's price behavior. The choice of chart type depends on the trading strategy, the trader's experience, and the specific goals of technical analysis. Beginner traders often use the line chart for its visual simplicity, while professionals tend to prefer Japanese candlesticks, which contain the most complete information about each price period. Switching between chart types on the Pocket Option platform takes a single click — the selection button is located in the top toolbar of the trading terminal, directly next to the timeframe selector.
Japanese Candlesticks (Candlestick)
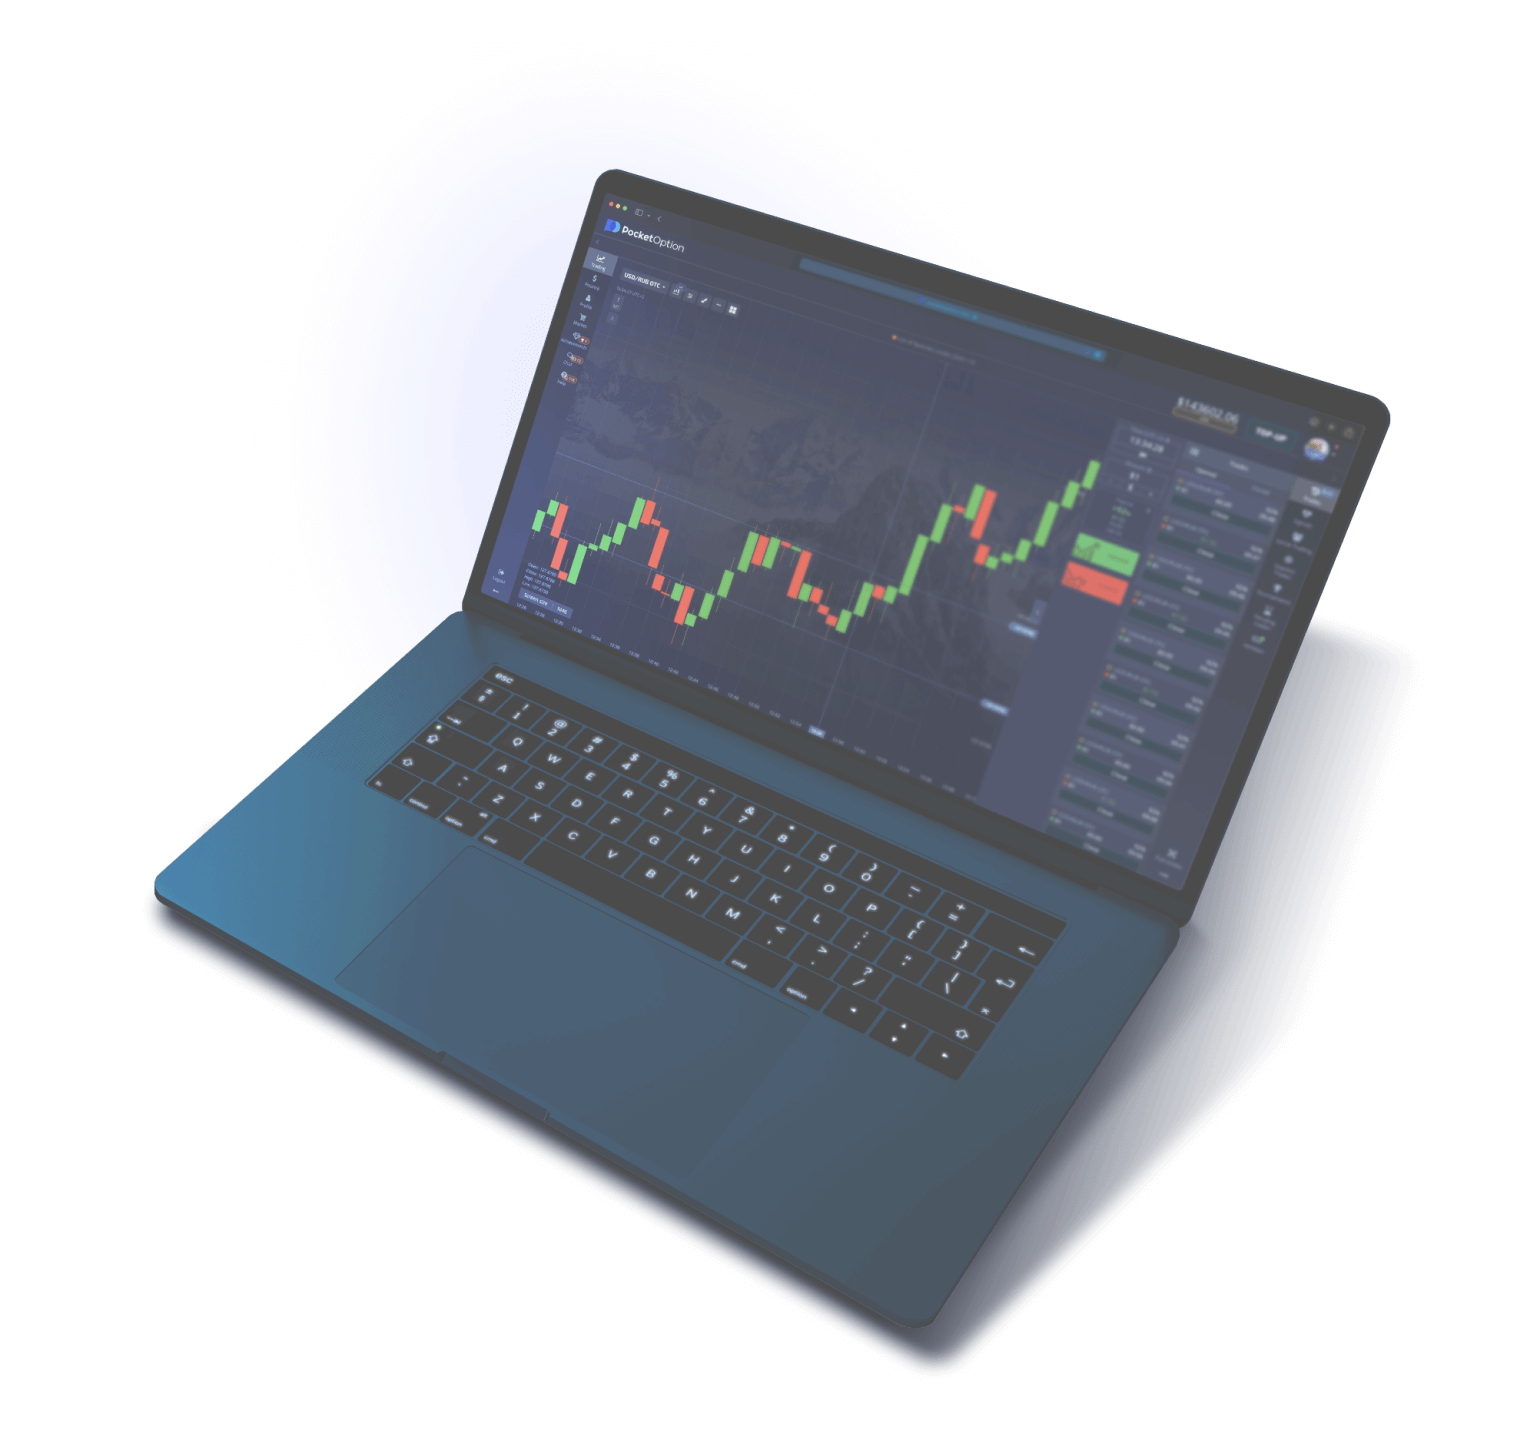
Japanese candlesticks are the most informative and popular chart type among binary options traders on Pocket Option. Each candle displays four key price parameters for the selected time period: the opening price (Open), the closing price (Close), the highest price (High), and the lowest price (Low). The candle body is formed by the distance between the opening and closing prices. If the closing price is higher than the opening price, the candle is colored green (a bullish candle), indicating upward movement. If the closing price is lower than the opening price, the candle is red (a bearish candle), signaling a decline. The vertical lines above and below the candle body are called shadows (or wicks) — they show the maximum and minimum price values for the period. Japanese candlesticks allow traders to visually assess the balance of power between buyers and sellers, identify the dominant trend, and recognize reversal patterns. It is on the candlestick chart that well-known patterns such as the hammer, doji, engulfing, morning star, and many other formations are identified and actively used in trading.
Bars (Bar chart / OHLC)
The bar chart displays the same four price parameters (Open, High, Low, Close) as Japanese candlesticks, but in a different visual format. Each bar is represented by a vertical line reflecting the range between the lowest and highest price for the period. A horizontal tick to the left of the vertical line indicates the opening price, while a tick to the right indicates the closing price. In terms of information content, bars are on par with Japanese candlesticks, though their visual interpretation requires more experience. Traders who come to Pocket Option from the stock or futures markets often prefer this display type, having grown accustomed to it through years of practice. The bar chart takes up slightly less screen space than the candlestick chart, allowing more time periods to fit on screen without horizontal scrolling. This can be useful when analyzing long-term trends on smaller monitors.
Line Chart (Line chart)
The line chart is the simplest type of visualization available on Pocket Option. It is built using a single price value for each period (typically the closing price), connecting the points with a smooth line. Unlike candlesticks and bars, the line chart does not show the opening, high, or low prices for each period, and therefore does not reflect intra-period volatility. The line chart clearly illustrates the overall direction of price movement and makes it easier to identify trends, support levels, and resistance levels. Many traders use it for a quick market overview before switching to the candlestick chart for detailed analysis. It is also convenient when comparing the dynamics of multiple assets in multi-chart mode, as lines from different instruments do not clutter the visual space. For beginner traders, the line chart is useful in that it allows them to focus on the big picture without being distracted by the details of each individual period.
Heiken Ashi
Heiken Ashi (Japanese for "average bar") is a modified candlestick chart in which the Open, High, Low, and Close values are calculated using special formulas based on averaged data from the current and previous periods. The Heiken Ashi closing price is calculated as the arithmetic mean of four values for the current period: (Open + High + Low + Close) / 4. The opening price is calculated as the average of the Open and Close of the previous Heiken Ashi candle. The High and Low are defined as the greatest and smallest values among three figures: the High, Heiken Ashi Open, and Heiken Ashi Close of the current period. Through averaging, Heiken Ashi significantly smooths out market noise — short-term price fluctuations that create a chaotic picture on a standard candlestick chart. The result: trends on the Heiken Ashi chart appear clearer and more sustained, sequences of same-direction candles are longer, and false signals are less frequent. This chart type is especially useful for trend trading on timeframes from 1 minute and above. However, due to averaging, Heiken Ashi lags slightly behind the real price, so it is not recommended for identifying precise entry levels. The optimal strategy is to use Heiken Ashi to determine trend direction and classic Japanese candlesticks to find specific trade entry points.
Area (fill)
An Area chart is a line chart with a color fill applied to the area between the price line and the lower boundary of the chart. Visually it resembles a topographic map, where the "mountains" reflect price highs and the "valleys" reflect lows. In terms of information content, the Area chart is identical to a line chart and is built on the same data — the closing price of each period. The difference is purely aesthetic: the color fill helps visually perceive the volume of price movement and the levels at which the price spent the most time. On Pocket Option, the Area chart is available as an alternative to the line chart and is used by traders who find it easier to read market conditions with a fill. In practical trading it is used for quickly monitoring multiple assets without switching to detailed candlestick analysis.
Comparison Table of Chart Types
| Chart Type |
Data |
Information Content |
Suitable For |
Patterns |
| Japanese Candlesticks |
Open, High, Low, Close |
Maximum |
All trader levels |
Full set of candlestick patterns |
| Bars (OHLC) |
Open, High, Low, Close |
Maximum |
Experienced traders |
Bar patterns (Inside Bar, Pin Bar) |
| Line |
Close |
Minimal |
Beginners, overview analysis |
Trend lines, levels |
| Heiken Ashi |
Averaged OHLC |
Medium (smoothed) |
Trend strategies |
Trend identification, candle color |
| Area |
Close (with fill) |
Minimal |
Monitoring, visual overview |
Trend lines, levels |
Recommendation for traders on Pocket Option: start with Japanese candlesticks. This chart type is the industry standard, and the vast majority of educational materials, strategies, and analytical tools are oriented specifically toward candlestick analysis. Once you master candlesticks, you can switch to other types as needed depending on the specific task.