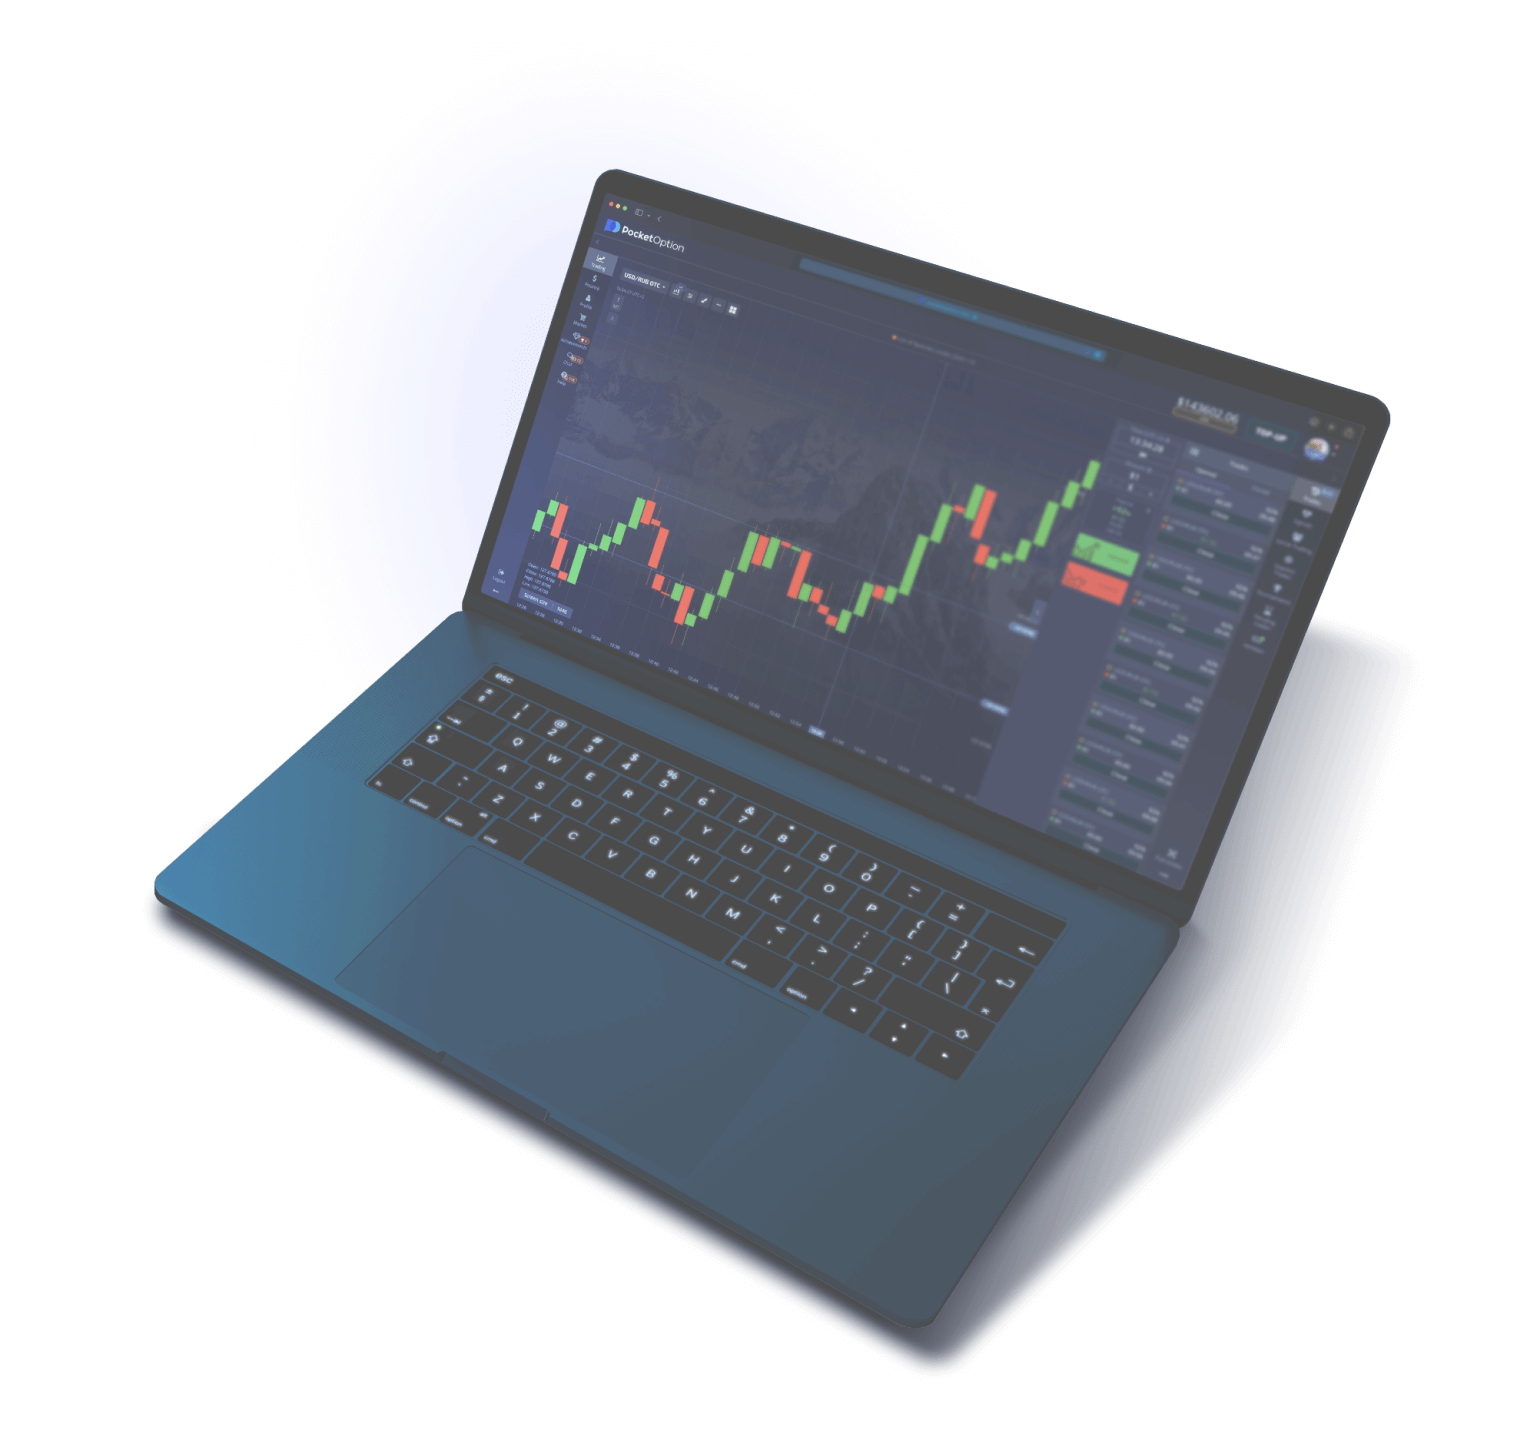
Pocket Option Trading Platform Interface
The Pocket Option Trading Platform is a web-based terminal accessible from any browser without installing additional software. The interface is designed with the needs of both beginner and professional traders in mind: all key controls are placed logically and intuitively, while advanced analysis tools do not clutter the workspace. Let us review the main areas of the trading terminal so you can navigate the platform from your very first minutes.
Central Area — Price Chart
The main part of the screen is occupied by an interactive price chart of the selected asset. Pocket Option supports several display types: Japanese candlesticks, bars (OHLC), line, area, and Heikin-Ashi. Each chart type has its advantages: Japanese candlesticks are the most informative for pattern analysis, the line chart is ideal for visually identifying trends, and Heikin-Ashi is useful for filtering market noise. The chart scale can be freely adjusted with the mouse wheel, and the timeframe is selected from the panel above the chart. Available timeframes: 5 seconds, 10 seconds, 15 seconds, 30 seconds, 1 minute, 5 minutes, 15 minutes, 30 minutes, 1 hour, 4 hours, 1 day, 1 week, 1 month. You can draw horizontal lines, trend lines, channels, Fibonacci levels, and other graphical tools on the chart for markup.
Right Panel — Trading Panel
On the right side of the screen is a compact trade management panel. It contains all the elements needed to open a position: the investment amount input field (with quick buttons for $1, $5, $10, $25, $50, $100), an expiration time selector, the current payout percentage for the selected asset, and two large buttons — green "Up" (Call) and red "Down" (Put). The panel also displays the current account balance, the number of open positions, and the total session result. The countdown to the nearest open trade's expiration is shown as a timer. The switch between the demo account and real account is also located here — switching modes happens with a single click without reloading the page.
Top Panel — Navigation and Assets
The top horizontal panel is used for platform navigation and quick switching between assets. On the left is a list of favorite assets (the trader can add any instrument to favorites for quick access), alongside a search bar for finding the desired asset by name or ticker. The asset catalog is organized by category: currencies, cryptocurrencies, stocks, commodities, indices, OTC. For each asset in the list, the name, current price, period change, and payout percentage are displayed. The top panel also features buttons for accessing trade history, social trading (copy trading), tournaments, and account settings.
Bottom Panel — Open Positions and History
At the bottom of the terminal is the panel with current open positions and the history of completed trades. For each open position, the asset, direction (Call/Put), investment amount, opening time, remaining time until expiration, and the current interim result (whether the position is in profit or loss at that moment) are displayed. The "History" tab contains a complete log of all executed trades with filtering by date, asset, and result. Statistics include the percentage of profitable trades, total profit and loss, average payout, and other metrics useful for analyzing trading performance. Data can be exported in CSV format for external analysis.
Indicators Panel
Pocket Option provides a library of more than 50 technical indicators that can be overlaid on the price chart. Indicators are divided into categories: trend (Moving Average, Bollinger Bands, Parabolic SAR, Ichimoku Cloud), oscillators (RSI, MACD, Stochastic, CCI, Williams %R), volume (Volume, OBV, Money Flow Index), and volatility (ATR, Standard Deviation). Each indicator has customizable parameters — periods, levels, and color scheme. Multiple indicators can be overlaid on the chart simultaneously, creating your own analytical system. Configured indicator combinations are saved in the trader's profile and accessible from any device.